

Costa Coffee Sales & Profit Performance Dashboard
A personal portfolio business intelligence project demonstrating how synthetic retail sales data can be transformed into executive-ready insights across revenue, profit, product performance, regional profitability, delivery efficiency, and operational KPIs.
Project Description
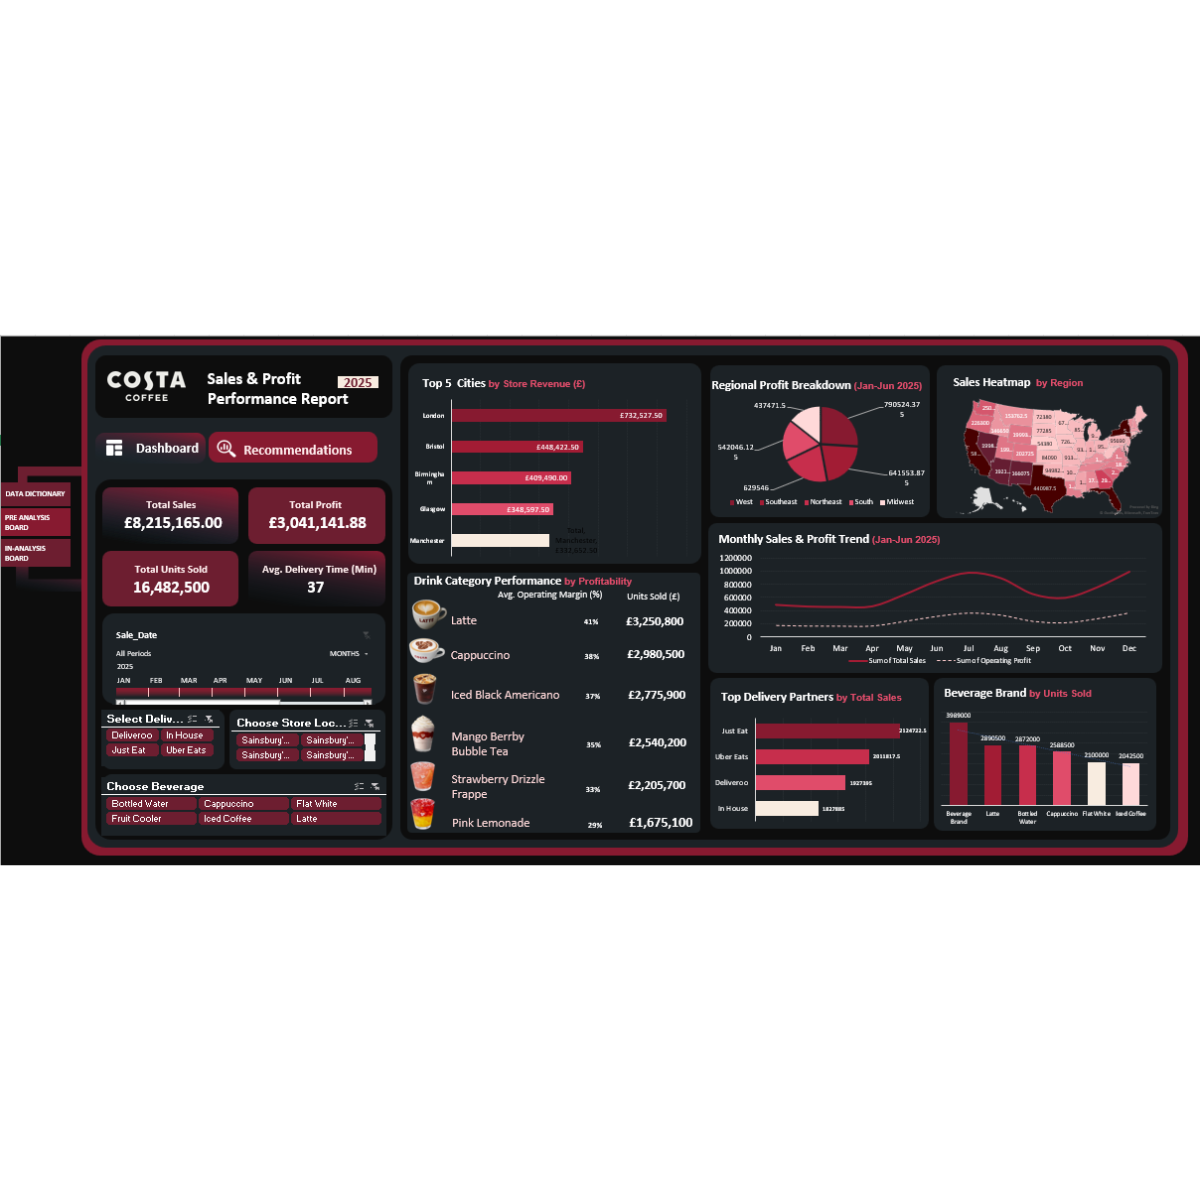
Costa Coffee Sales & Profit Performance Dashboard is a personal portfolio business intelligence project demonstrating comprehensive data analytics and data visualisation capability. Built using synthetic retail data, the dashboard shows how complex sales data can be transformed into actionable insights for strategic decision-making.
The dashboard models realistic commercial metrics including £8.2M+ in annual revenue, £3M+ in annual profit, 16.4M+ units sold, product performance analysis, regional profitability breakdowns, and operational efficiency indicators.
The project was created to demonstrate enterprise-level analytics skills: transforming fragmented sales data from multiple stores, delivery partners, and product categories into a unified, executive-ready analytics platform.
Project Overview
The dashboard illustrates how businesses can move beyond static spreadsheet reports into dynamic, drill-down analytics that identify trends, optimise product mix, and support decisions around inventory, pricing, regional expansion, and delivery performance.
I designed and developed the complete analytics solution from data modelling through to interactive visualisation, focusing on an intuitive interface that balances comprehensive metrics with a clean visual hierarchy.
Business Intelligence Goals
The project was designed to answer strategic retail and hospitality performance questions through a single executive dashboard.
- Identify top-performing stores, cities, products, and categories.
- Track revenue, profit, units sold, and operating margin performance.
- Compare delivery partner efficiency and average delivery times.
- Analyse product-level margins across beverages and SKUs.
- Understand regional sales concentration through geographical analysis.
- Support inventory, pricing, and expansion strategy decisions.
- Move from static reporting into interactive, filterable business intelligence.
Key Dashboard Features
Executive KPI Cards
Built clear KPI cards for revenue, profit, units sold, average delivery time, and overall performance visibility.
Product Performance Analysis
Analysed beverage category performance and SKU-level profitability to identify high-performing products and margin improvement opportunities.
Regional Profitability Breakdown
Created regional and city-level analysis to compare revenue, profit, sales concentration, and top-performing locations.
Delivery Partner Efficiency
Compared delivery partner metrics and operational performance using indicators such as delivery time and channel contribution.
Geographical Heatmap
Included geographical sales concentration analysis to demonstrate how regional patterns can guide expansion decisions and resource allocation.
Date Filtering and Trend Analysis
Added date filtering to support seasonal pattern analysis, year-over-year comparisons, and performance tracking over time.
Drill-Down Interactivity
Enabled users to filter by date range, store location, delivery partner, product category, beverage type, and individual SKU.
Dark Executive Theme
Designed the dashboard with a premium dark theme using Costa-inspired burgundy and pink accents for presentation-ready visual storytelling.
Data Model and Pipeline
The synthetic data pipeline models realistic sales transactions across stores, delivery partners, beverage categories, SKUs, regions, and dates. It demonstrates how raw transactional records can be aggregated into a clean, decision-ready reporting model.
Transaction Modelling
Modelled synthetic sales data representing over 16.4 million units sold across multiple products, locations, channels, and delivery partners.
Profitability Calculations
Built calculations for revenue, profit, operating margin, product-level contribution, and category profitability.
Store and City Analysis
Structured store-level and city-level breakdowns, including top-performing cities generating £732K+ in revenue.
Operational KPI Monitoring
Included operational metrics such as 37-minute average delivery time, delivery partner performance, and channel efficiency.
Interactive Dashboard Experience
Beyond static reporting, the dashboard features interactive drill-down capabilities across multiple dimensions. Users can explore performance by date range, store location, delivery partner, beverage category, region, and individual product.
Executive Dashboard Interaction Model
The interface was designed for stakeholder meetings and executive presentations, allowing decision-makers to move from headline KPIs into deeper operational and commercial analysis.
Analytics and Decision Logic
Product Mix Optimisation
The dashboard helps identify which products generate the strongest revenue, margin, and unit volume, supporting better product mix and promotional decisions.
Regional Expansion Insight
Regional and city-level analysis supports decisions about where to allocate marketing, inventory, store investment, and delivery resources.
Operational Efficiency Tracking
Delivery time, delivery partner performance, and channel analysis help reveal operational bottlenecks and customer experience risks.
Margin Visibility
Product-level operating margins ranging from 17% to 38% provide granular visibility into profitability and category performance.
Dashboard Design Approach
The dashboard uses a dark-themed executive design with strategic Costa Coffee-inspired brand colours, including burgundy, black coffee tones, and pink accents. This gives the dashboard a polished presentation style while keeping numbers readable and visually prioritised.
- Dark background for executive presentation impact.
- Burgundy and pink accents used to highlight priority metrics.
- Clean KPI cards for fast performance interpretation.
- Structured chart hierarchy to avoid visual overload.
- Interactive filtering for stakeholder-led exploration.
- Retail-focused layout for revenue, profit, product, and regional analysis.
Technical Architecture
Data and Modelling
- Synthetic retail sales data
- SQL and data modelling concepts
- Revenue and profit calculations
- Operating margin modelling
- Product category hierarchy
- Regional sales segmentation
Analytics Layer
- Business intelligence logic
- KPI development
- DAX-style calculations
- Predictive analysis concepts
- Statistical analysis
- Trend and seasonality analysis
Visualisation Layer
- Microsoft Excel dashboarding
- Power BI / Tableau-style thinking
- Interactive filters
- Geographical heatmap logic
- Executive KPI visuals
- Data storytelling design
Project Outcome
The outcome is a portfolio-ready business intelligence platform that demonstrates how complex retail data can be consolidated into clear, actionable insights. It showcases the ability to transform raw transactional data into strategic business intelligence for retail, hospitality, and e-commerce decision-making.
- Modelled £8.2M+ in annual revenue using synthetic retail sales data.
- Modelled £3M+ in annual profit with product and regional visibility.
- Analysed over 16.4M units sold across stores, channels, and products.
- Tracked operational performance including a 37-minute average delivery time.
- Visualised product-level operating margins ranging from 17% to 38%.
- Identified top-performing cities generating £732K+ in revenue.
- Built interactive drill-downs across date, location, delivery partner, category, and SKU.
- Created an executive-ready dashboard design using Costa-inspired brand styling.
My Role
Business Intelligence Developer and Retail Data Analyst
I designed and developed the complete analytics solution, covering data modelling, KPI development, profitability logic, interactive dashboard design, and executive visual storytelling.
I also created the synthetic data model, structured the retail analytics dimensions, developed the dashboard layout, built the performance indicators, and designed the dark Costa-inspired visual system for stakeholder-ready presentation.
Leave A Comment