

KennOres Healthcare Recruitment Dashboard
A comprehensive workforce analytics dashboard built in Microsoft Excel to monitor recruitment performance, compliance, attrition, training, staff retention, and workforce readiness across multiple healthcare departments.
Project Description
KennOres Healthcare Recruitment Dashboard is a comprehensive workforce analytics solution designed to monitor recruitment performance, compliance, and staff retention across multiple healthcare departments.
The project was built entirely in Microsoft Excel, integrating advanced data modelling, dynamic pivot systems, and interactive dashboards to help healthcare recruiters track key operational KPIs such as attrition, job satisfaction, training compliance, and vaccination rates.
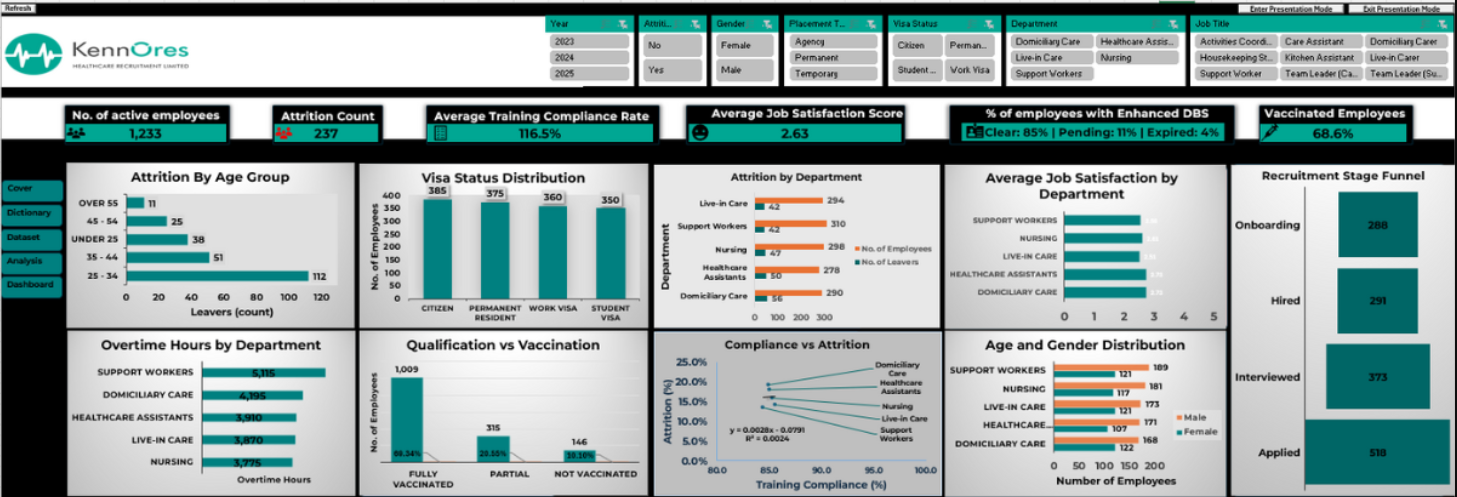
At its core, the dashboard provides a real-time view of workforce health, translating complex HR datasets into clear, actionable visual insights for senior management and operational recruitment teams.
Project Overview
The system consolidates over 1,200 employee records covering five core healthcare job groups: Support Workers, Nursing, Live-In Care, Healthcare Assistants, and Domiciliary Care.
Built for operational leaders and HR analysts, the dashboard empowers healthcare recruiters to make evidence-based staffing decisions, improve compliance visibility, and enhance service delivery through measurable insights.
The Challenge
Healthcare recruitment teams need to manage workforce supply, compliance, retention, and readiness across different job roles and departments. The challenge was to convert a complex HR dataset into a simple decision-making tool that non-technical users could interact with confidently.
- Monitor attrition risk across age groups, departments, and visa status.
- Track recruitment movement from applications through onboarding.
- Measure training compliance and connect it to workforce retention patterns.
- Highlight vaccination and DBS readiness for healthcare workforce compliance.
- Identify overtime pressure, department imbalance, and productivity gaps.
- Enable non-technical users to filter and explore the data through slicers.
Key Dashboard Components
Attrition Analysis
Segmented attrition by age, department, visa status, and job group to highlight high-risk retention zones and workforce stability issues.
Recruitment Funnel
Built a visual recruitment funnel tracking each stage from applications to onboarding, enabling precise conversion and drop-off analysis.
Training Compliance Tracker
Measured training completion percentages and correlated them with attrition rates using regression analysis.
Vaccination and DBS Monitoring
Highlighted workforce readiness and compliance alignment with CQC and NHS recruitment standards.
Overtime Breakdown
Analysed overtime patterns to identify workload pressure, staffing gaps, resource imbalance, and productivity risks across care segments.
Departmental Analysis
Compared performance across healthcare departments to reveal workforce distribution, engagement, satisfaction, and retention patterns.
Dynamic Slicer Controls
Added slicers for year, visa type, gender, and employment type, allowing users to filter insights without touching the underlying dataset.
Senior Management KPI View
Created executive-level KPI cards and visual summaries to help senior leaders quickly understand workforce health and recruitment risks.
Analytics and Decision Logic
Retention Risk Analysis
Used attrition segmentation to identify which employee groups were most likely to leave, helping managers focus retention strategies where they matter most.
Compliance Intelligence
Built compliance indicators for training, vaccination, and DBS readiness, giving the business a clearer view of workforce suitability and operational risk.
Recruitment Conversion Tracking
Converted recruitment stages into a funnel-style analysis to identify where candidates were dropping off before onboarding.
Regression-Based Insight
Applied regression analysis to explore the relationship between training compliance and attrition patterns, supporting deeper evidence-based workforce interpretation.
Dashboard Design Approach
The dashboard interface follows KennOres-inspired design principles using clear typography, healthcare tones, structured layouts, and the brand colour #009999 to promote clarity, accessibility, and trust.
The layout was designed for practical decision-making, with clean KPI cards, intuitive chart groupings, dynamic slicers, and visual sections that guide users from high-level workforce health into deeper operational analysis.
Interactive Filtering System
The dashboard includes dynamic slicers so recruiters, HR analysts, and managers can filter the workforce view without needing technical Excel knowledge.
Excel Architecture
Data Model
- Structured employee dataset
- 1,200+ employee records
- Healthcare job group classification
- Recruitment stage fields
- Compliance indicators
- Retention and attrition metrics
Analytics Layer
- Dynamic PivotTables
- Pivot charts
- Calculated fields
- Regression analysis
- KPI calculations
- Trend and segmentation analysis
Dashboard Layer
- Interactive slicers
- Executive KPI cards
- Recruitment funnel visuals
- Compliance tracker visuals
- Attrition charts
- Healthcare-branded layout
Project Outcome
The final dashboard gives healthcare recruitment leaders a clear view of workforce health, recruitment performance, compliance readiness, and staff retention risk. It turns raw HR records into a practical management tool for evidence-based decision-making.
- Consolidated over 1,200 employee records into one workforce intelligence dashboard.
- Tracked recruitment performance across five key healthcare job groups.
- Created attrition analysis by age, department, and visa status.
- Built a recruitment funnel from applications through onboarding.
- Measured training compliance and explored its relationship with attrition.
- Monitored vaccination and DBS readiness for healthcare workforce compliance.
- Identified overtime and departmental imbalance across care segments.
- Enabled non-technical users to interact with insights through dynamic slicers.
My Role
Excel Dashboard Developer and Healthcare Workforce Analyst
I designed and built the dashboard end-to-end in Microsoft Excel, covering data modelling, KPI design, dynamic PivotTables, PivotCharts, slicers, dashboard layout, statistical interpretation, and healthcare-focused visual storytelling.
I also structured the analysis around recruitment, attrition, compliance, training, vaccination, DBS readiness, overtime, and departmental workforce performance to support practical decision-making for healthcare recruitment teams.
Leave A Comment