

Spotify Streaming Insights Dashboard | 2010-2019
A dark-themed music analytics dashboard designed to analyse Spotify streaming performance across artists, songs, genres, years, playlist appearances, and music modality trends between 2010 and 2019.
Project Description
Spotify Streaming Insights is a music performance analytics dashboard that presents streaming activity from 2010 to 2019 in a structured and visually engaging layout.
The dashboard focuses on core music intelligence areas including top-performing artists, yearly streaming trends, most streamed songs, genre distribution, modality analysis, and playlist appearances.
It also includes a left-side filter panel for artist, year, and genre, making the dashboard easy to explore and suitable for music insight reporting.
Project Overview
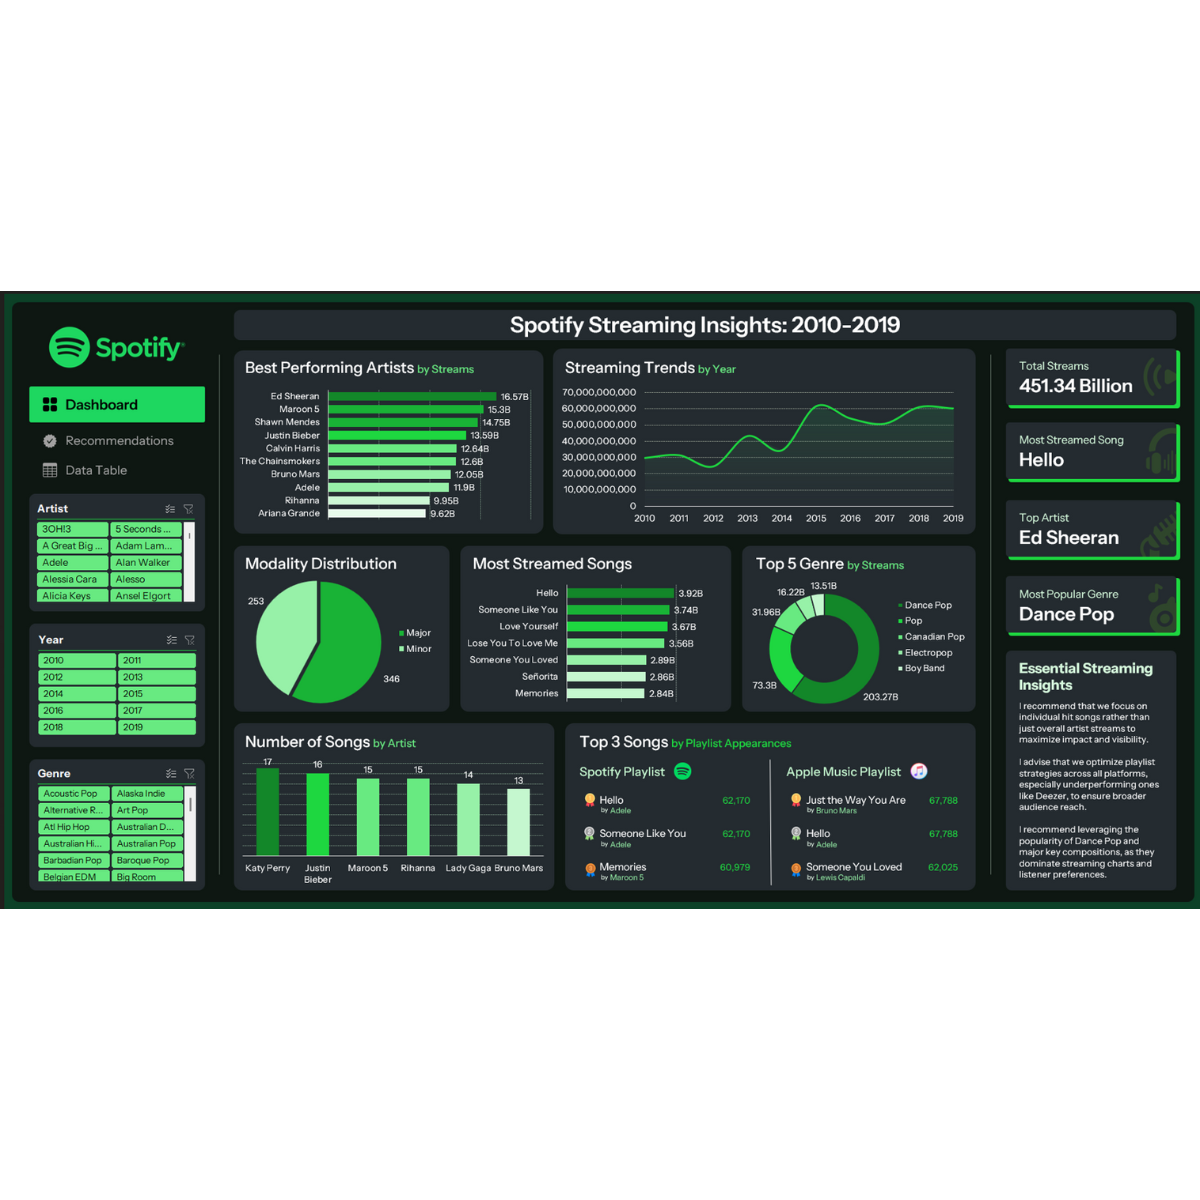
The dashboard was designed to turn streaming data into clear insight for music performance analysis. It combines KPI cards, bar charts, donut charts, a line chart, ranking visuals, and a recommendation panel into one executive-style reporting interface.
The visual identity follows a Spotify-inspired design system with dark charcoal panels, bright green accents, and clean card-based chart containers, allowing dense information to remain readable and visually consistent.
Main Dashboard Sections
Performance Summary
KPI cards on the right summarise the biggest headline metrics including total streams, most streamed song, top artist, and most popular genre.
Streaming Analysis
The centre of the dashboard focuses on artist performance, streaming trends by year, song rankings, genre share, and playlist visibility.
Interactive Filtering
The left panel includes filter groups for artist, year, and genre, helping users narrow the analysis to specific music segments.
Insight Recommendation Panel
A dedicated text panel titled Essential Streaming Insights provides recommendation-style commentary based on the dashboard findings.
Key Metrics and Insights Shown
- Total Streams: 451.34 Billion.
- Most Streamed Song: Hello.
- Top Artist: Ed Sheeran.
- Most Popular Genre: Dance Pop.
- Highest Artist Stream Value Shown: Ed Sheeran with 16.57B streams.
- Streaming Period Covered: 2010 to 2019.
- Modality Split Shown: Major 346 and Minor 253.
- Top Genre by Stream Share Shown: Dance Pop with 203.27B streams.
Artist and Song Analysis
Best Performing Artists by Streams
The dashboard ranks artists by total streams, showing Ed Sheeran at the top, followed by Maroon 5, Shawn Mendes, Justin Bieber, Calvin Harris, The Chainsmokers, Bruno Mars, Adele, Rihanna, and Ariana Grande.
Most Streamed Songs
The most streamed songs visual shows Hello as the leading song, followed by Someone Like You, Love Yourself, Lose You To Love Me, Someone You Loved, Señorita, and Memories.
Number of Songs by Artist
A separate ranking compares artist song counts, showing Katy Perry, Justin Bieber, Maroon 5, Rihanna, Lady Gaga, and Bruno Mars.
Top 3 Songs by Playlist Appearances
The dashboard compares playlist appearances across Spotify Playlist and Apple Music Playlist, highlighting songs such as Hello, Someone Like You, Memories, Just the Way You Are, and Someone You Loved.
Genre and Music Pattern Analysis
Top 5 Genre by Streams
The genre donut chart shows Dance Pop as the dominant genre, followed by Pop, Canadian Pop, Electropop, and Boy Band.
Modality Distribution
A pie chart compares song modality, showing a larger Major segment with 346 entries and a smaller Minor segment with 253 entries.
Streaming Trends by Year
The yearly trend chart tracks stream movement from 2010 through 2019, showing visible growth after 2012, peaks around the mid to late years, and continued strong performance toward 2018 and 2019.
Essential Streaming Insights
The dashboard includes a narrative insight card recommending attention to individual hit songs, wider playlist strategies, and strong genre positioning, particularly around Dance Pop.
Interactive Filtering System
The left-side navigation and slicer area allows viewers to explore the dashboard using a compact control panel. This helps make the dashboard practical for presentation and exploratory analysis.
Dashboard Filters and Navigation
The sidebar includes navigation tabs and three visible filter groups for music analysis. These controls support quick breakdowns by performer, time period, and genre family.
Dashboard Design Approach
The dashboard uses a Spotify-inspired interface with a black and deep charcoal background, neon green accents, rounded cards, and consistent chart framing. This creates a strong visual identity while keeping the data readable.
- Spotify-branded green and dark theme styling.
- Right-hand KPI panel for headline metrics.
- Centre content area for charts and ranking visuals.
- Left sidebar for filters and dashboard navigation.
- Combination of bar charts, donut charts, pie charts, and line charts.
- Embedded text insights panel for narrative recommendations.
Technical Architecture
Data Structure
- Streaming performance dataset
- Artist dimension
- Song dimension
- Genre categorisation
- Year-based trend dimension
- Playlist appearance ranking
Analytics Layer
- Total stream calculations
- Artist ranking analysis
- Song ranking analysis
- Genre share analysis
- Modality analysis
- Time trend analysis
Visualisation Layer
- KPI summary cards
- Horizontal bar charts
- Line trend chart
- Pie and donut charts
- Playlist comparison panel
- Interactive filter panel
Project Outcome
The final dashboard demonstrates how music streaming data can be organised into a polished analytical interface for artist comparison, song ranking, genre analysis, and year-over-year trend review.
- Presented a complete Spotify streaming dashboard covering 2010 to 2019.
- Displayed 451.34 Billion total streams.
- Identified Hello as the most streamed song shown.
- Highlighted Ed Sheeran as the top artist shown.
- Showed Dance Pop as the most popular genre shown.
- Compared top artists, top songs, top genres, and yearly streaming trends.
- Included modality distribution with Major 346 and Minor 253.
- Showcased playlist appearance rankings across Spotify and Apple Music.
- Included sidebar filters for artist, year, and genre exploration.
My Role
Music Analytics Dashboard Designer and Data Visualisation Developer
I designed the dashboard structure, visual hierarchy, chart layout, KPI presentation, filter arrangement, and Spotify-inspired theme. I also organised the analysis into artist, song, genre, yearly trend, and playlist insight sections for easier interpretation.
My focus was to create a visually strong reporting experience that makes music streaming performance easy to understand at a glance while still supporting deeper exploration through ranked charts and filters.
Leave A Comment